Extract:

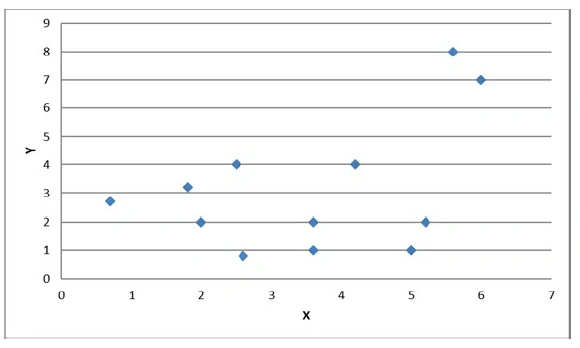
Which of the following is the best description of the relationship between Y and X?
-
A
The data has normal distribution.
-
B
X and Y have a negative relationship.
-
C
No relationship
-
D
X and Y have a positive relationship.
X and Y have a positive relationship because, as the values of X increase, the values of Y generally tend to increase as well, indicating an upward trend in the data points on the graph.
When analyzing scatter plots, the key focus is whether points move upward, downward, or show no consistent pattern as X increases. In this graph, although the points are somewhat scattered, higher X-values are associated with higher Y-values overall, which signals a positive relationship.
A. The data has normal distribution
A normal distribution refers to how data values are distributed around a mean, typically forming a bell-shaped curve. This option does not describe the relationship between two variables. Additionally, scatter plots are used to assess correlation or association, not distribution shape, making this option irrelevant to the question.
B. X and Y have a negative relationship
A negative relationship would be evident if Y consistently decreased as X increased, forming a downward-sloping pattern. The graph does not show this behavior. Instead, several of the highest Y-values occur at larger X-values, directly contradicting a negative association.
C. No relationship
If there were no relationship, the points would appear randomly scattered with no visible upward or downward trend. While the data is not perfectly linear, there is a noticeable tendency for Y-values to rise as X increases. This observable pattern rules out the idea of no relationship.
D. X and Y have a positive relationship
This option correctly describes the pattern shown. As X increases from left to right, the Y-values generally increase, especially among the higher X-values. Even with some variability, the overall direction of the data supports a positive association between the two variables.
Conclusion
By observing the general upward trend of the data points as X increases, the relationship between X and Y is best described as positive. Although the points are not perfectly aligned, the overall pattern clearly shows that higher X-values are associated with higher Y-values, confirming a positive relationship.