Extract:

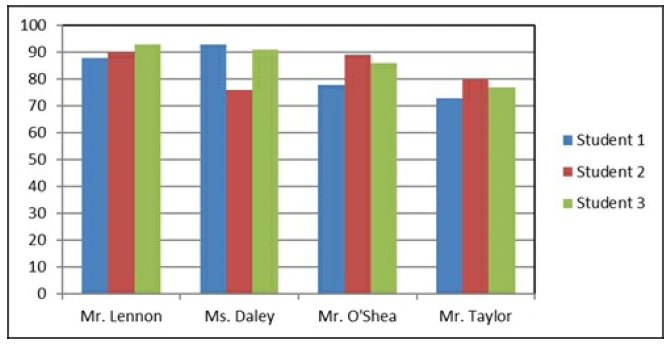
The following graph compares the various test scores of the top three students in each of these teacher’s classes. Based on the graph, which teacher’s students had the lowest range of test scores?
-
A
Mr. Lennon
-
B
Mr. O’Shea
-
C
Mr. Taylor
-
D
Ms. Daley
Mr. Lennon’s students had the lowest range of test scores because the difference between the highest and lowest scores in his class is smaller than that of the other teachers.
The range of a data set is found by subtracting the lowest value from the highest value. A smaller range indicates that the scores are more tightly clustered together, showing less variation among students. When examining the graph, Mr. Lennon’s three student scores are very close to one another, indicating minimal spread.
A. Mr. Lennon
The three scores for Mr. Lennon’s students appear to be close in value, all falling within a narrow band near the high 80s to low 90s. The highest score is only a few points above the lowest score. This small difference results in the lowest range among all the teachers shown, indicating the most consistent performance across the three students.
B. Mr. O’Shea
Mr. O’Shea’s students show a wider spread of scores. One student scores in the high 70s, while another is near the high 80s. This larger gap between the highest and lowest values increases the range, making it greater than Mr. Lennon’s range.
C. Mr. Taylor
The scores in Mr. Taylor’s class vary more noticeably than those in Mr. Lennon’s class. The lowest score is in the low 70s, while the highest reaches around 80. Although the range is not extremely large, it is still greater than the tightly grouped scores seen in Mr. Lennon’s class.
D. Ms. Daley
Ms. Daley’s class has the greatest variation among the three students. One score is significantly lower than the others, while another is among the highest on the graph. This wide separation between the lowest and highest scores results in a large range, eliminating this option.
Conclusion
By comparing the spread of scores for each teacher, Mr. Lennon’s class clearly shows the smallest difference between the highest and lowest test scores. This minimal variation indicates the lowest range among the groups, confirming that Mr. Lennon is the correct answer.