100%
4
Rated
Attempts
127
Extract:
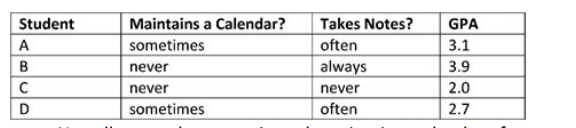
A researcher is exploring factors that contribute to the GPA of college students. While the sample is small, the researcher is trying to determine what the data shows. What can be reasoned from the table below?
-
A
A researcher is exploring factors that contribute to the GPA of college students. While the sample is small, the researcher is trying to determine what the data shows. What can be reasoned from the table below?
-
B
There is an inverse correlation between maintaining a calendar and GPA, and there is a positive correlation between taking notes and GPA.
-
C
There is a positive correlation between maintaining a calendar and GPA, and there is no correlation between taking notes and GPA.
-
D
There is no correlation between maintaining a calendar and GPA, and there is a positive correlation between taking notes and GPA.
A
A researcher is exploring factors that contribute to the GPA of college students. While the sample is small, the researcher is trying to determine what the data shows. What can be reasoned from the table below?
B
There is an inverse correlation between maintaining a calendar and GPA, and there is a positive correlation between taking notes and GPA.
C
There is a positive correlation between maintaining a calendar and GPA, and there is no correlation between taking notes and GPA.
D
There is no correlation between maintaining a calendar and GPA, and there is a positive correlation between taking notes and GPA.
Related Questions
Top Picks
A scientist is trying to determine how much poison will kill a rat the fastest. Which of the following statements is an example of an appropriate hypothesis?
Which of the following is a representation of a natural pattern or occurrence that's difficult or impossible to experience directly?
In testing how quickly a rat dies by the amount of poison it eats, which of the following is the independent variable and which is the dependent variable?
Which of the following is a standard or series of standards to which the results from an experiment are compared?
Which of the following correctly displays 8,600,000,000,000 in scientific notation (to two significant figures)?
Available FREE Test
Sets
Available Test
Sets