100%
4
Rated
Attempts
127
Extract:
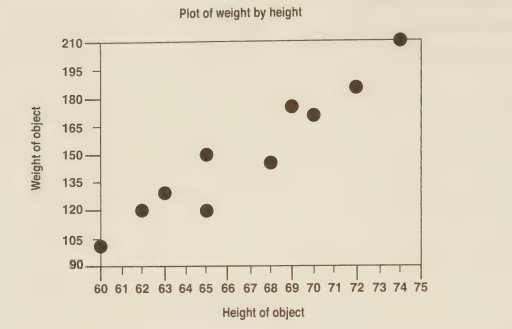
Based on the following graph, what does this data show?
-
A
Weight is independent of height.
-
B
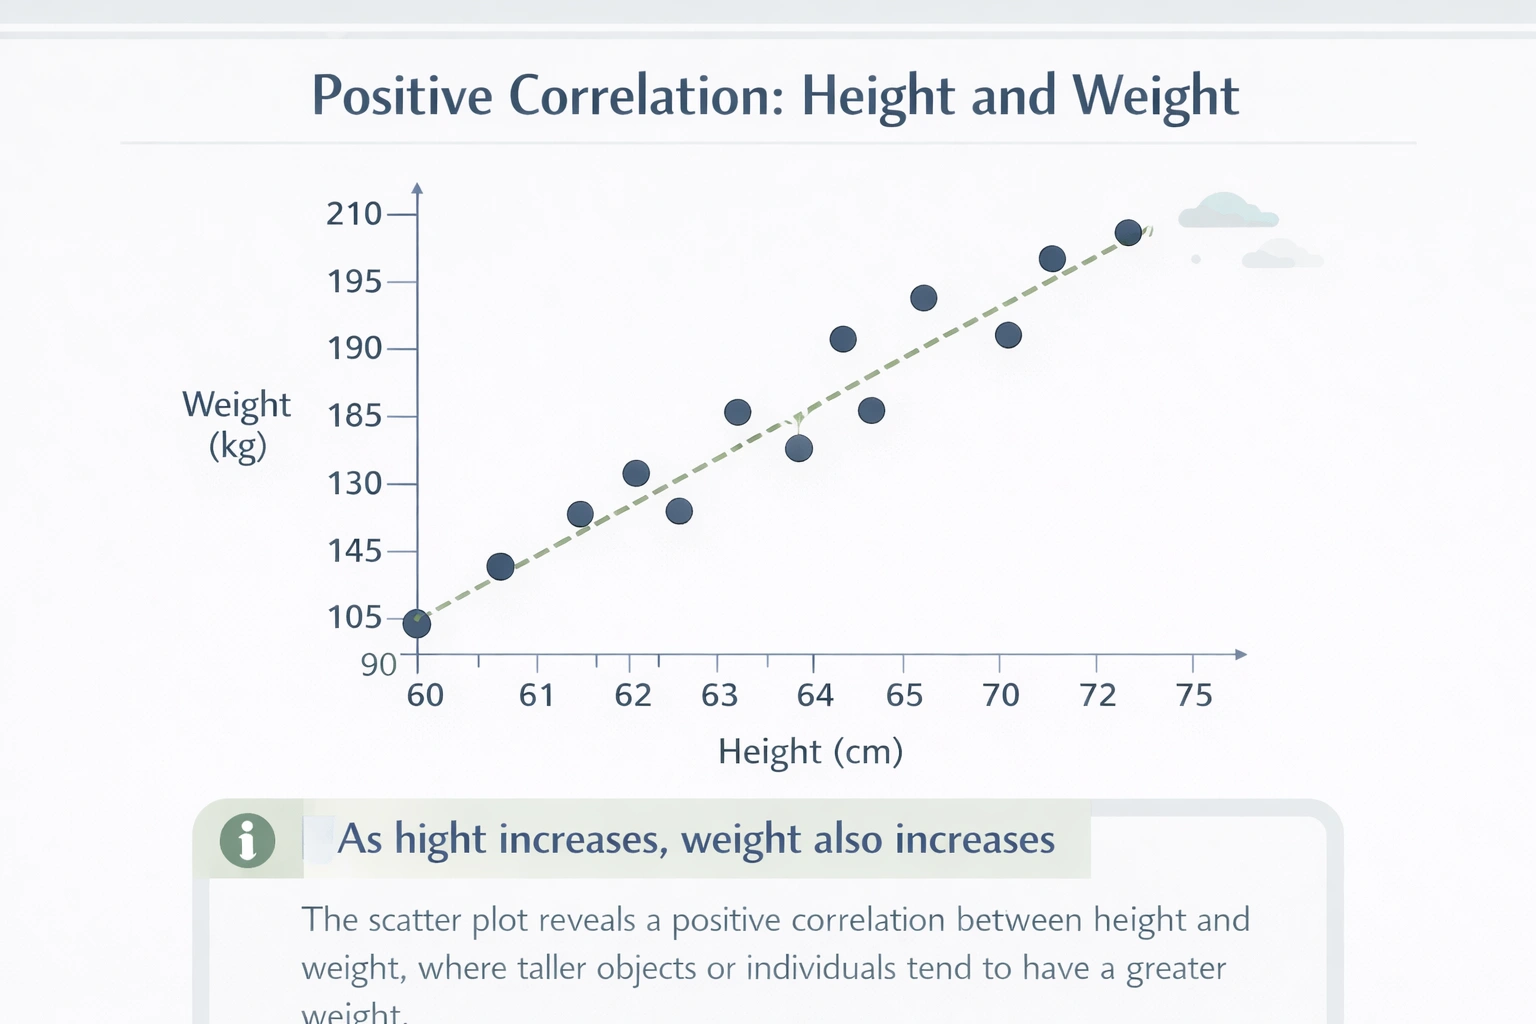
As height increases, weight also increases.
-
C
Weight is indirectly correlated with height.
-
D
A negative variation exists between weight and height.
A
Weight is independent of height.
B
As height increases, weight also increases.
C
Weight is indirectly correlated with height.
D
A negative variation exists between weight and height.
Related Questions
Top Picks
During which of the following phase changes will the cohesion between the particles in a substance increase?
Empirical evidence is
Zinc-64 is one possible isotope of the element zinc. Which of the atoms described below is a different isotope of zinc?
If sodium sulfide (Na₂S) and hydrochloric acid (HCl) react in a double-replacement reaction, what product(s) form?
Which of the following atoms will have an overall negative charge?
Available FREE Test
Sets
Available Test
Sets