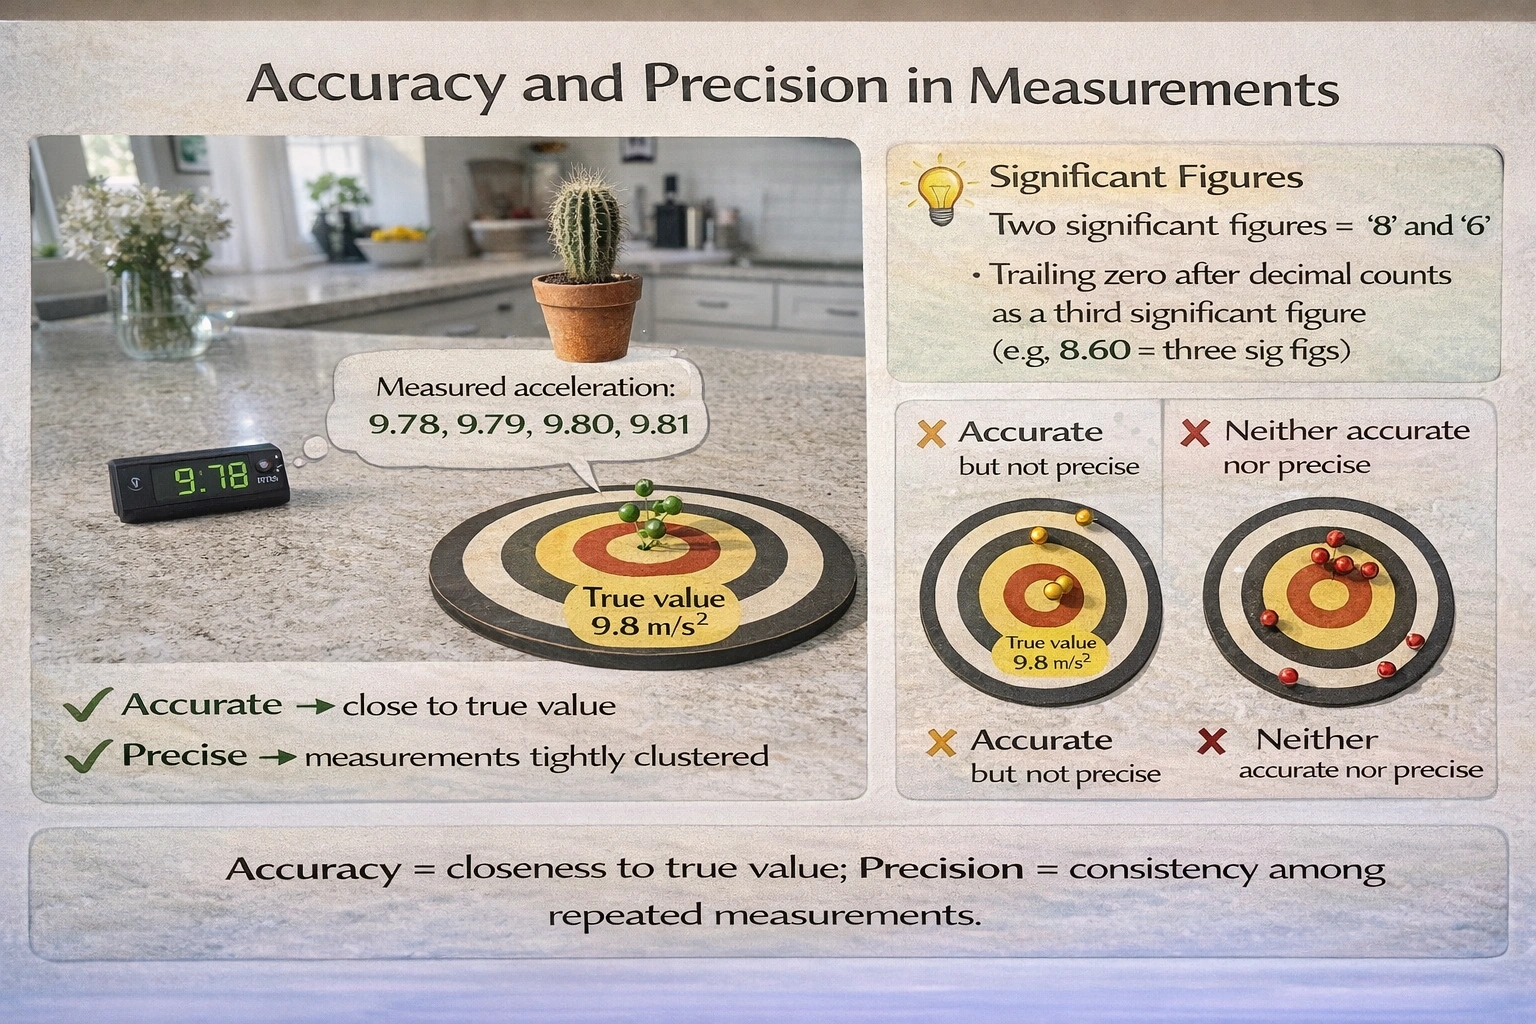
The acceleration of a falling object due to gravity has been proven to be 9.8 m/s². A scientist drops a cactus four times and measures the acceleration with an accelerometer and gets the following results: 9.79 m/s², 9.81 m/s², 9.80 m/s², and 9.78 m/s². Which of the following accurately describes the measurements?
-
A
They're both accurate and precise.
-
B
They're accurate but not precise.
-
C
They're precise but not accurate.
-
D
They're neither accurate nor precise.
The measurements demonstrate both accuracy (closeness to the true value of 9.8 m/s²) and precision (consistency among repeated measurements), with values clustering tightly around the accepted gravitational acceleration constant.
Accuracy reflects proximity to the true or accepted value, while precision indicates reproducibility of measurements regardless of their correctness—both essential qualities for reliable experimental data that can be distinguished through statistical analysis of measurement distributions.
A) They're both accurate and precise
All four measurements (9.78, 9.79, 9.80, 9.81 m/s²) fall within ±0.02 m/s² of the true value 9.80 m/s²—demonstrating accuracy with minimal systematic error. The range spans only 0.03 m/s² (9.81 - 9.78) with a standard deviation of approximately 0.013 m/s²—indicating high precision through tight clustering. The mean (9.795 m/s²) rounds to 9.80 m/s², matching the accepted value. This combination of minimal bias (accuracy) and minimal random error (precision) represents ideal measurement quality.
B) They're accurate but not precise
Inaccurate precision would manifest as widely scattered measurements centered near the true value (e.g., 9.5, 9.9, 9.7, 10.1 m/s² averaging to 9.8). The actual measurements show minimal scatter (range 0.03 m/s²), contradicting "not precise." Precision quantifies measurement repeatability independent of correctness; these values demonstrate exceptional repeatability.
C) They're precise but not accurate
Precise inaccuracy would appear as tightly clustered measurements distant from the true value (e.g., 10.3, 10.4, 10.3, 10.4 m/s²). The measurements cluster near 9.8 m/s² rather than deviating systematically—no evidence of calibration error or systematic bias that would produce consistent offset from truth.
D) They're neither accurate nor precise
This would require both wide scatter and systematic deviation from truth (e.g., 8.5, 10.2, 9.1, 11.0 m/s²). The measurements exhibit neither characteristic—they cluster tightly around the correct value.
Conclusion:
Measurement quality assessment requires separate evaluation of accuracy (systematic error/bias) and precision (random error/repeatability). These cactus drop measurements exemplify ideal experimental outcomes: minimal deviation from accepted physical constants combined with exceptional measurement consistency. Option A correctly identifies this dual quality—essential for validating experimental apparatus and methodology. Distinguishing accuracy from precision prevents misinterpretation of data quality: precise but inaccurate measurements indicate calibration issues requiring correction, while accurate but imprecise measurements suggest excessive random error needing improved technique or instrumentation. Both qualities together establish measurement reliability fundamental to scientific validity.
