100%
4
Rated
Attempts
127
Extract:
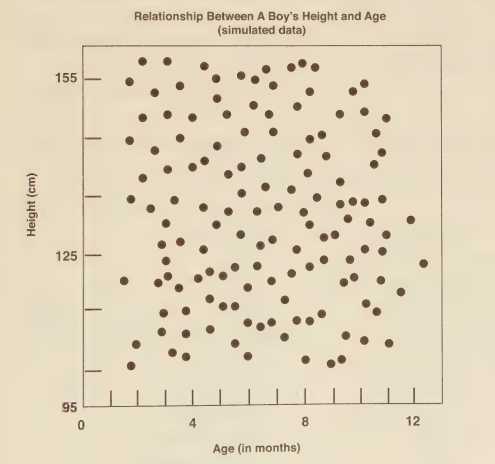
Which analysis describes the results shown in the following image?
-
A
As a baby gets older, he gets taller.
-
B
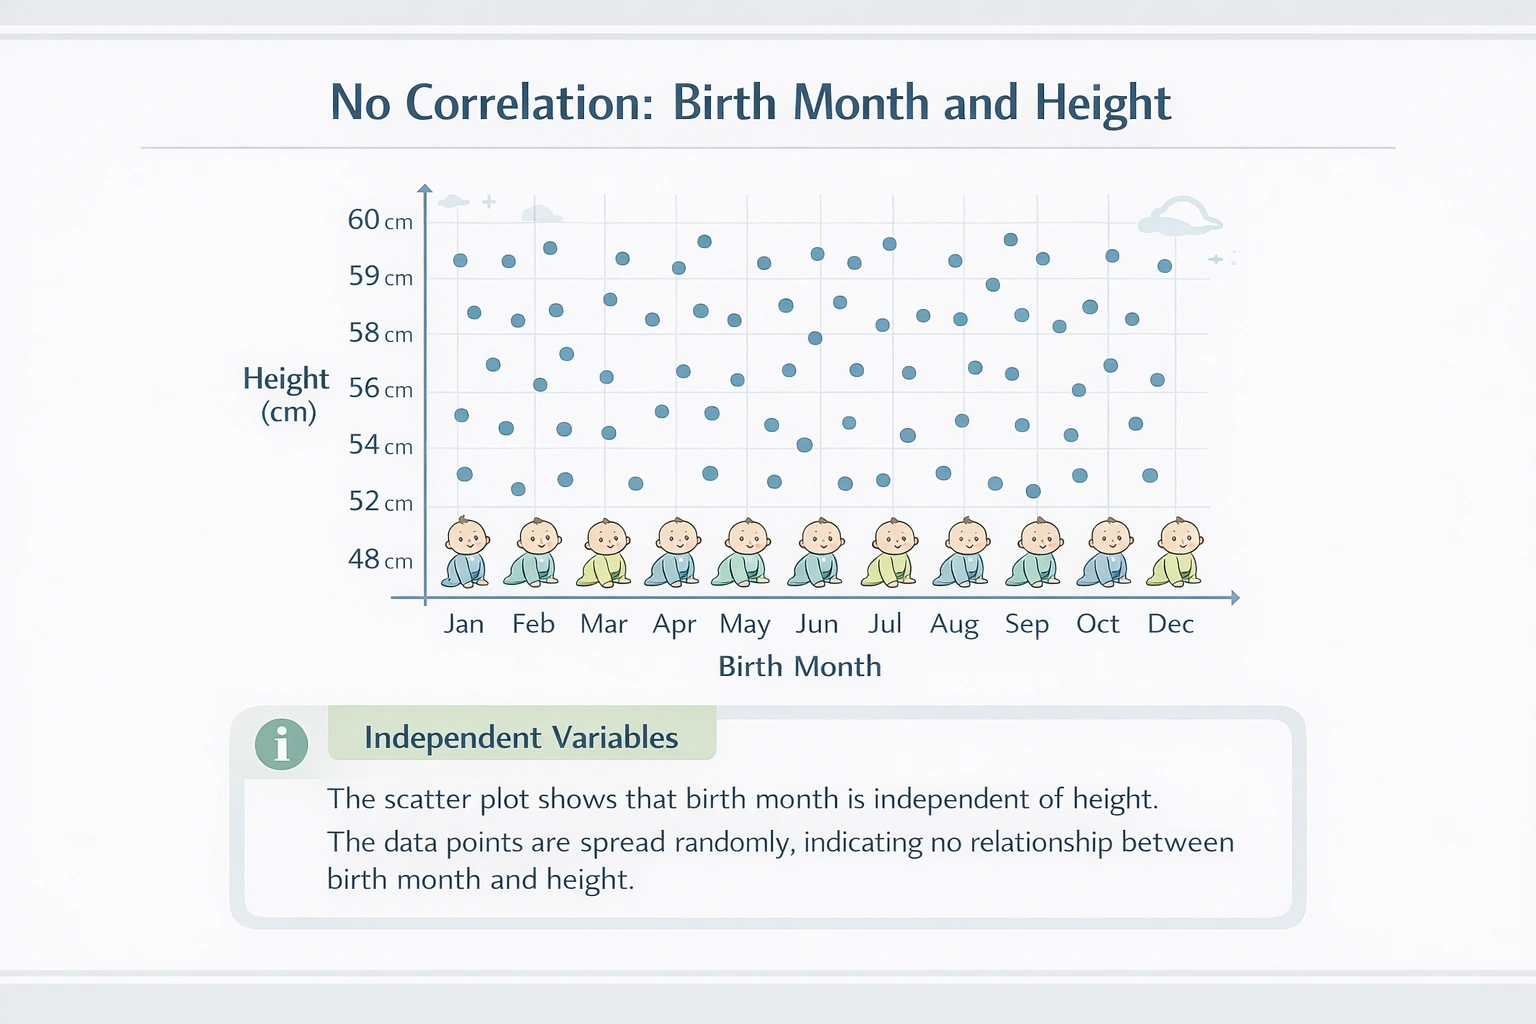
Birth month is independent of height.
-
C
Older boys are taller than younger boys.
-
D
A baby's height stays the same every month.
A
As a baby gets older, he gets taller.
B
Birth month is independent of height.
C
Older boys are taller than younger boys.
D
A baby's height stays the same every month.
Topic Flashcards
Click to FlipMini Quiz
1 / 3
A scatter plot showing a random distribution of points proves that one variable causes no change in the other.
Related Questions
Top Picks
Three different dispersants that are used to break up oil in water are evaluated for their effectiveness. Dispersant A has a concentration of 10m, dispersant B has a concentration of 7m, and dispersant C has a concentration of 3m. Each dispersant is separately poured into a solution of water and oil. The amount of time it takes each dispersant to disperse the oil is recorded. Which of the following statements describes the positive correlation observed in this study?
Inside a plant, water has to travel up, against gravity, to reach all the leaves. What property does this illustrate?
Time is measured using a
If barium metal (Ba) and aluminum chloride (AlCl₃) react in a single-replacement reaction, what product(s) form?
Based on the following graph, what does this data show?
Available FREE Test
Sets
Available Test
Sets